This is the first in a series of posts looking at the Presidential election results in the state of Georgia.
Let’s start with the top line numbers from the last three Presidential elections:
| Year | Democrat | Republican | ||
|---|---|---|---|---|
| Votes | Percentage | Votes | Percentage | |
| 2000 | 1,116,230 | 43.2% | 1,419,720 | 55.0% |
| 2004 | 1,366,155 | 41.4% | 1,914,256 | 58.0% |
| 2008 | 1,844,137 | 46.9% | 2,048,744 | 52.1% |
In 2000, Al Gore lost Georgia by 11.8 points and Kerry lost by 16.6 points. Obama has reduced that to 5.2 points, which is a swing of 11.4 percent from 2004. This swing is greater than the national swing of 9.2%.
Let’s look at the Georgia exit polls from 2000, 2004 and 2008.
During the last 8 years, the composition of the voters has changed a lot. The table below shows the percentage of voters who belonged to a specific race or ethnic group.
| Race | 2000 | 2004 | 2008 |
|---|---|---|---|
| White | 81% | 70% | 65% |
| African American | 19% | 25% | 30% |
| Hispanic | – | 4% | 3% |
That’s quite a change in voter demographics, Compare that to the census estimate of population (in 2006) of 58.9% non-Hispanic whites, 29.9% African Americans and 7.5% Hispanics. This shows that African Americans, probably for the first time in Georgia history, voted in proportion of their population. The credit for that goes to the Obama campaign’s voter registration and Get-Out-the-Vote (GOTV) efforts.
Turnout this year was a little lower than 2004, mostly because of the high turnout among whites in 2004.
| 2000 | 2004 | 2008 | |
|---|---|---|---|
| Total | 69% | 77% | 76% |
| White | 71% | 80% | 78% |
| African American | 63% | 72% | 75% |
Since I am estimating White and African American turnout in 2008 from the exit polls, it might be prone to some error. We’ll know more when all the detailed data is released by the Georgia Secretary of State.
If African American turnout could be higher, Obama might have gotten closer by at most 1 point. However, do remember that in absolute numbers 41% more African Americans voted this year compared to 2004. The increase in the number of white voters was less than 9%.
The next table shows why Obama lost. It tells us what portion of whites and blacks voted for the Democratic Presidential candidate in the last three elections.
| Race | 2000 | 2004 | 2008 |
|---|---|---|---|
| White | 35% | 23% | 23% |
| African American | 86% | 88% | 98% |
Obama needed around 27% or more of the white vote. However, he got the same proportion as Kerry.
Looking at voter groups, 37% of all voters (i.e. 57% of white voters) were white evangelicals. Obama got only 10% among them. Since he got 23% among all whites, so Obama got 40% of the white non-evangelical vote. Compare to Kerry who got 16% of white evangelical vote and 30% of white non-evangelical vote. Also, compare nationally where Obama got 43% of the white vote and 24% of white evangelical voters, i.e. Obama got a majority (53%) of non-evangelical white vote nationally.
Young voters nationally flocked to Obama in this election, a lot more than in recent elections. This can be seen in the graphs here.
| 18-29 | 30-44 | |||
| US | GA | US | GA | |
| All | 66% | 48% | 52% | 56% |
| White | 54% | 20% | 41% | 32% |
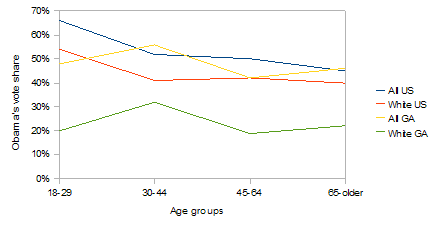
The low number (20%) for 18-29 year old white voters in Georgia surprised me a lot. It shows how difficult it might be for Democrats to win Georgia even in the future.
Nationally, Obama did somewhat better with white voters than Kerry in 2004. However, there were regional variations. In Appalachia and parts of the South, Obama got a smaller percentage of the white vote than Kerry did.
Southern counties that voted more heavily Republican this year than in 2004 tended to be poorer, less educated and whiter, a statistical analysis by The New York Times shows. Mr. Obama won in only 44 counties in the Appalachian belt, a stretch of 410 counties that runs from New York to Mississippi. Many of those counties, rural and isolated, have been less exposed to the diversity, educational achievement and economic progress experienced by more prosperous areas.
The increased turnout in the South’s so-called Black Belt, or old plantation-country counties, was visible in the results, but it generally could not make up for the solid white support for Mr. McCain. Alabama, for example, experienced a heavy black turnout and voted slightly more Democratic than in 2004, but the state over all gave 60 percent of its vote to Mr. McCain. (Arkansas, however, doubled the margin of victory it gave to the Republican over 2004.)
Less than a third of Southern whites voted for Mr. Obama, compared with 43 percent of whites nationally.
Do look at this table and a map of the US showing county-level electoral shifts.
MSNBC First Read gives the details of Obama vote share among whites.
In 13 [states], Obama received less than 35% of the white vote. His three lowest performing states: Alabama (10%), Mississippi (11%), and Louisiana (14%). The other 10: GA (23%), SC (26%), TX (26%), OK (29%), AR (30%), UT (31%), AK (32%), WY (32%), ID (33%), and TN (34%). On the other hand, Obama won the white vote in 18 states and DC: CA, CO, CT, DE, DC, HI, IL, IA, ME, MA, MI, MN. NH. NY. OR, RI, WA, WI and VT. Obama’s lowest percentage of the white vote he received in a state that he won: NC (35%). The highest percentage of the white vote Obama received in a state he lost: MT (45%).
Razib has a few maps showing Obama’s performance among white voters in all the states compared to Kerry’s performance in 2004 as well as to the national average for white voters this year.
Pollster shows that in states with higher than about 20-25% of African American population, Obama performed poorly among white voters.
If you are interested in comparing Democratic or Republican performance over the years in Presidential elections in Georgia, Dave Leip’s Atlas of US Presidential elections has the historical results in a convenient table format.
All things considered, Barack Obama did very well in Georgia. I was always skeptical about the Democrats winning Georgia, except in a national landslide. How well did the Obama campaign bigwigs think they could do in Georgia can be gauged from this anecdote from August 27.
[Obama’s election manager David Plouffe] said that the campaign’s target in Georgia is about 47% of the vote, owing to Ex-Rep. Bob Barr’s ability to siphon votes away from John McCain.
In the end, Bob Barr didn’t do well at all, but Obama got his 47% of the vote. It looks to me like the Obama campaign knew what it was doing. Do you remember the Obama spreadsheet that leaked just after Super Tuesday and was remarkably accurate about the primary results?
There’s a lot more I want to analyze, including county and precinct level data, precincts in which our team worked. So tune in for more analysis and rambling soon.
Hi Zack,
is it really true that a clear majority of Muslims voted Democrat? Do you have the data? If so, I am in someways surprised as I take the view that generally Muslims have more in common with Republican views – except on foreign policy. Rgds…
Sycologist: See my articles about surveys of American Muslims before and after the 2004 election.
The statistics show that coloured population hasincreased. It appears that many of them didn’t have voting rights earlier.
Georgia Election Analysis II
I look at the detailed county level results for the 2008 Presidential election and also try to quantify the effects of race.
Dad: African Americans and Hispanics etc have voting rights. However, the voting among the poor is generally much less. Also, the number of Hispanics and Asian Americans has increased quite a bit in recent years.
Georgia Election Analysis III
Today I dig deeper into the Presidential election results in Fulton county and specifically the precincts in Alpharetta, Milton and South Atlanta where our team of Obama volunteered worked.
Georgia Senate Runoff Analysis
Why did Jim Martin lose so badly in the runoff when he had done so well in the general election?